- Published on
Next.js ISR filled 143 GB and OOM-killed my server
- Author

- Name
- Karuppusamy D
- Headline
- Senior Software Engineer
My phone specs site kept getting OOM-killed, and the Node heap was healthy the whole time. The problem was on disk. Next.js's ISR cache writes three files for every URL it renders and never deletes any of them, and after a few weeks of crawler traffic that was 143 GB of files and a gigabyte of kernel memory. This post covers the measurements, the cause in Next's source, the fix, and how to check your own container in a few minutes.
The symptom: OOM-killed with a heap under 400 MiB
TechBuz is a phone specs site I have run since 2021. It has about 4,900 phones, a page per phone, a page per brand, and a compare page for any combination of phones. It runs as a Next.js 16 app in a Docker Swarm task with a 2 GiB memory limit, behind Cloudflare.
The container kept dying. After a restart it sat at about 0.23 GB. Over a few days it climbed to 1.66 GB, hit the limit, and the kernel killed it. Then the cycle started again.
The obvious suspect was a JavaScript leak, so I started with the heap. The heap was fine. This is the cgroup accounting from the task at 97.6% of its 2 GiB limit:
memory.stat field | What it holds | Measured | Share |
|---|---|---|---|
anon | process memory: V8 heap plus memory allocated outside it | 395 MiB | 20% |
file | page cache | 705 MiB | 35% |
slab | kernel data structures, mostly dentries and inodes | 930 MiB | 47% |
Two more numbers ruled out the process itself:
RssAnonfrom/proc/1/statuswent up and down across samples (232, 286, 261, 395 MiB) instead of climbing. That is what a working garbage collector looks like.RssFilestayed near 73 MiB, so the loaded program files weren't growing either.
Half the container was kernel slab.
These are the commands, if you want the same view of your own container:
C=my-next-app   # container name or id

# the limit, and the anon/file/slab split
docker exec $C sh -c 'cat /sys/fs/cgroup/memory.current /sys/fs/cgroup/memory.max; grep -E "^(anon|file|slab) " /sys/fs/cgroup/memory.stat'

# process RSS split: RssAnon is heap plus native, RssFile is mapped files
docker exec $C sh -c 'grep -E "^(VmRSS|RssAnon|RssFile)" /proc/1/status'

# how many times the cgroup has hit its ceiling
docker exec $C cat /sys/fs/cgroup/memory.events
Don't use docker stats for this. It reports memory.current minus inactive_file. In one interval it fell 45 MiB while actual usage rose 161 MiB.
Why kernel slab counts against a container's limit
Under cgroup v2, the kernel charges memory it allocates on a process's behalf to that process's cgroup. The kernel documentation describes slab in memory.stat as memory used for in-kernel data structures, and slab_reclaimable as the part that might be reclaimed, "such as dentries and inodes".
In plain terms: every file the process touches costs a dentry (the kernel's record of the file's name) and an inode (its record of the file itself) in kernel memory. That memory is charged to the container, and memory.max applies to the total.
So a Node process can sit at 400 MiB while its container sits at 2 GiB. The kernel holds the other gigabyte in directory entries and inodes for files the process created. When the cgroup hits its limit, the OOM killer picks the largest process in it, which is node. The heap snapshot you took just before shows nothing wrong.
Slab that large comes from files. Either a huge number of them on disk, or a stream of them being created and deleted.
Suspect one: the image optimizer fighting its disk cache limit
The first thing I found was a cache that kept evicting and re-creating files.
Image optimization runs in production, so sharp and libvips run inside the server process. Next writes the optimized variants to .next/cache/images. That cache has a size cap, images.maximumDiskCacheSize, and evicts the least recently used entries when it is full.
I had never set the cap. The default checks free disk once at startup and uses 50% of it. On this container's disk that came to about 500 MB.
The number of possible entries was far bigger than that:
- Every combination of URL, width and quality is a separate entry.
- The defaults give 8
deviceSizesand 7imageSizes. - Multiply that by every remote image across two CDN hosts, and crawlers walk all of it.
I measured 19.1 GB written into a 500 MB directory. Write a variant, evict an older one, build that one again on the next request, repeat. Every create and every delete costs the kernel a dentry and an inode.
The Open Graph route made it worse. ImageResponse hardcodes public, max-age=0, must-revalidate in production, so every crawler hit re-rendered the card. The route also fetched each phone image through this same container's /_next/image, which cost two more optimizations per render.
I fixed all of that:
maximumDiskCacheSizeis set explicitly.deviceSizesandimageSizesare narrowed to the widths the app requests.experimental.imgOptConcurrencyis 1.experimental.imgOptMaxInputPixelsis 25 MP instead of the 268 MP default.- The OG route sends a one-year
Cache-Controland fetches from the CDN directly.
I wrote it up, deployed it, and considered it done. That fixed a real problem, and it wasn't the main one. The diagnostic that found it only ever looked under .next/cache.
The real driver: ISR entries that Next never deletes
Three weeks later the container's disk had reached 146 GB. du put almost all of it in one place:
143G    /app/.next/server/app/compare
2.7G    /app/.next/server/app/specs
Memory told the same story as before: slab at 983 MiB against a healthy heap, with heapUsedRatio at 0.32.
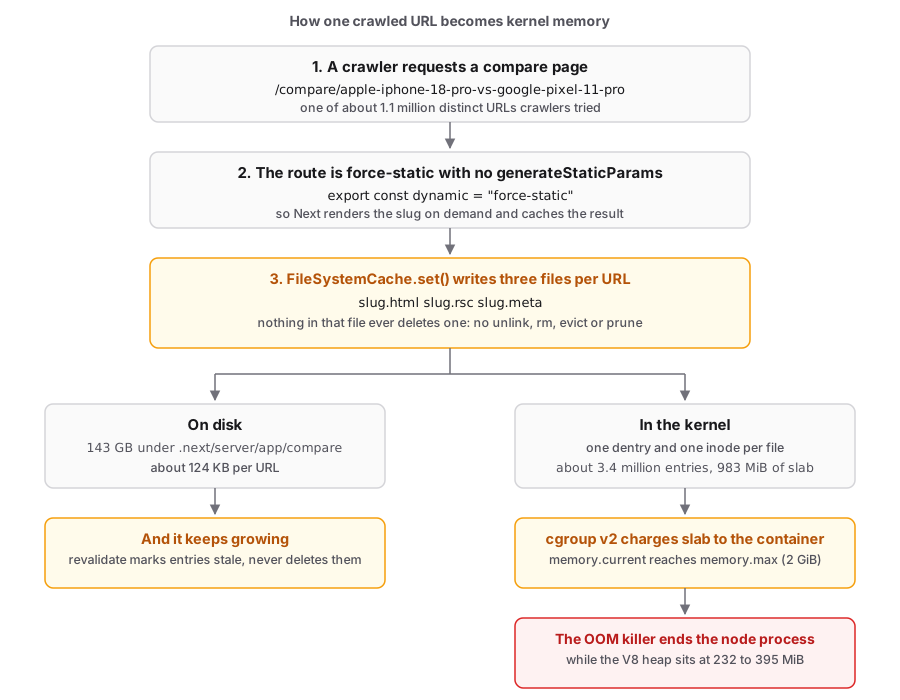
.next/server/app/<route>/ is where Next's FileSystemCache writes the ISR entries it renders at request time. For every distinct URL it renders, set() writes three files: one .html, one .rsc and one .meta.
// next/dist/server/lib/incremental-cache/file-system-cache.js, set(), condensed
const htmlPath = this.getFilePath(`${key}.html`, IncrementalCacheKind.APP_PAGE);
writer.append(htmlPath, data.html);
writer.append(
  this.getFilePath(`${key}${RSC_SUFFIX}`, IncrementalCacheKind.APP_PAGE),
  data.rscData
);
writer.append(
  htmlPath.replace(/\.html$/, NEXT_META_SUFFIX),
  JSON.stringify(meta)
);
The full version is in file-system-cache.ts. What the file does not contain is any code that removes an entry:
- I grepped it for
unlink,rm,evict,pruneand anything resembling a size cap. Nothing. - There is a
get()and aset(). revalidateonly decides when an entry counts as stale and gets rendered again. It never removes one.
That is the difference from the image cache, which is capped by maximumDiskCacheSize and stayed flat the whole time.
Four routes were force-static on a dynamic segment with no generateStaticParams:
| Route | Possible slugs |
|---|---|
/compare/[mobiles] | every combination of phones, so no practical limit |
/api/getSummary/[path] | the same slugs as compare |
/specs/[url] | one per phone, about 4,900 |
/brand/[brand] | one per brand |
Under that setup Next renders every slug a request asks for and keeps the result forever. A compare slug looks like apple-iphone-18-pro-vs-google-pixel-11-pro. With about 4,900 phones, the valid pairs alone run into the millions, and crawlers had requested about 1.1 million of them. The specs and brand routes are limited to real phones and brands, and even there Next wrote an entry for every unknown slug a crawler tried.
notFound() does not save you. A not-found result is written as a normal cache entry with status: 404 in its .meta, so garbage slugs cost the same three files as real ones.
The numbers on disk and in memory agree
Two separate measurements should agree if this is the cause, and they do.
From the memory side:
- 983 MiB of slab at roughly 300 bytes per dentry and inode pair is about 3.4 million inodes.
- Three files per URL gives about 1.1 million cached URLs.
From the disk side:
- 143 GB across 1.1 million entries is about 124 KB per entry.
- That is what a compare page's HTML plus its RSC payload comes to.
The slab that was pushing the container into the OOM killer was the kernel's index of the ISR cache.
The fix: force-dynamic at the origin, s-maxage at the edge
The fix has three parts, and the third is the one that is easy to miss.
1. Make the routes dynamic
The route segment config dynamic went from force-static to force-dynamic on all four routes:
export const dynamic = "force-dynamic";A dynamic route never reaches IncrementalCache.set, so nothing is written under .next/server/app for it.
2. Send a Cache-Control the edge can use
That removes the origin cache entirely, so caching moves to the CDN. headers() in next.config.js sets the header:
async headers() {
  return [
    {
      source: "/compare/:mobiles",
      headers: [
        {
          key: "Cache-Control",
          value: "public, max-age=0, s-maxage=43200, stale-while-revalidate=86400",
        },
      ],
    },
    // the same block for /specs/:url and /brand/:brand
  ];
}
What each directive does:
max-age=0keeps browsers revalidating.s-maxage=43200lets the edge hold a page for 12 hours.stale-while-revalidate=86400lets it serve the old copy while it fetches a new one.
Next's own default for a dynamic page is private, no-cache, no-store, but it only applies that when the response has no Cache-Control already. The comment in send-payload.js says the check is there "to allow users to customize it via next.config", so the configured header wins.
3. Tell Cloudflare to cache HTML
Cloudflare does not cache HTML by default. It caches by file extension, and these paths have none, so every page came back cf-cache-status: DYNAMIC. With the origin cache gone, that would have made every request a Postgres query.
A Cache Rule fixes it:
- Match the four path prefixes.
- Mark them eligible for cache.
- Set Edge TTL to use the
Cache-Controlheader if present, and bypass otherwise. - Turn Origin Cache Control on, so
s-maxageapplies to the edge andmax-age=0to the browser as separate values.
Deploy the rule before, or together with, the build that makes the routes dynamic.
What I checked before deploying
On a production build:
- The build output reports all four routes as dynamic.
- The configured
Cache-Controlis on every response. - A run of requests that included garbage slugs left zero files under
.next/server/app/{compare,specs,brand,api/getSummary}.
On the live site, the second request for any compare page comes back cf-cache-status: HIT:
curl -sI https://techbuz.net/compare/apple-iphone-18-pro-vs-google-pixel-11-pro | grep -iE "cf-cache-status|^age:"Reclaiming the 143 GB
The running task still held the files. The compiled route code lives in the [mobiles] subdirectory next to them, so do not delete the compare directory. Delete only the cache files directly inside it, and nothing in its subdirectories:
find /app/.next/server/app/compare -maxdepth 1 -type f \
  \( -name "*.html" -o -name "*.rsc" -o -name "*.meta" \) -delete
generateStaticParams is the other way out
When the list of possible slugs is limited, there is a second option that keeps ISR: generateStaticParams with dynamicParams = false. Unknown slugs then 404 without rendering and without a cache write, and the files on disk are limited to the list you return.
That would have worked for /specs and /brand. It cannot work for /compare, where the possible slugs are every combination of phones. So all four routes went force-dynamic and the edge caches them.
Two fixes that look right and are not
Calling notFound() early does not prevent the write. The 404 is cached like any other result, as above.
A custom cacheHandler can keep the files off disk, since IncrementalCache.set hands the write to it. That is a reading of the source, not something I measured. It does not stop a second, smaller growth in the same code path:
SharedCacheControls.cacheControlsin shared-cache-controls.external.ts is astatic Map.IncrementalCache.setwrites to it before handing off to the handler, keyed bytoRoute(pathname).toRouteonly strips a trailing slash or/index, so the key is the exact URL rather than the route pattern.- Its
clear()method is never called on a production serve path.
At roughly 150 to 250 bytes an entry it takes millions of distinct URLs to matter, but it never stops growing, and the same force-static routes on dynamic segments feed it. force-dynamic avoids it for the same reason it avoids the disk write: set is never reached.
How to check your own app
-
Read the cgroup split with the commands above. If
slabis the biggest number whileRssAnonrises and falls, you are looking at files, and a heap snapshot will show you nothing. -
Count the files:
docker exec $C sh -c 'du -sh /app/.next/server/app/* | sort -h | tail; find /app/.next/server/app -type f | wc -l' -
Look for
export const dynamic = "force-static"on a[param]route that has nogenerateStaticParams. Each one persists a set of files for every distinct URL it has ever served, garbage included. -
Check
images.maximumDiskCacheSize. If it is unset, the image cache is half of whatever disk was free at startup. A file count that stays flat while bytes keep being written is the sign of that evict-and-rebuild loop.
Read the memory fields together rather than one at a time:
| What you see | What it means |
|---|---|
slab climbing, heapUsed and rss flat | Files being created and deleted, or a very large file count. Look at .next/server/app and .next/cache/images. |
file climbing, process rss flat | Page cache. Reclaimable, and not a leak. |
heapUsed flat or rising and falling, heapTotal and rss climbing toward the heap limit | V8 growing its heap as it needs to. Not a leak. |
heapUsed climbing across GC cycles | JavaScript is really holding on to memory. Take a heap snapshot. |
rss climbing while every heap field is flat | Memory allocated outside V8, such as by libvips or WASM. A heap snapshot will show nothing. |
The container now logs one JSON line a minute with heapUsedRatio and cgroupRatio in it, and warns when either passes a threshold. The next time one of those rows starts climbing, it shows up in the log instead of as a restart.
Takeaways
- A container can be OOM-killed with a healthy heap. Under cgroup v2, kernel slab for dentries and inodes counts against the limit, so read
memory.statbefore you take a heap snapshot. - Next's filesystem ISR cache never evicts anything. A
force-staticroute on a dynamic segment with nogenerateStaticParamswrites three files for every URL it ever serves, 404s included. - If the possible slugs have no limit, make the route
force-dynamicand let the CDN cache it withs-maxage. If they are limited,generateStaticParamswithdynamicParams = falsekeeps ISR and caps the files. - Set
images.maximumDiskCacheSizeyourself. The default of half the free disk came to about 500 MB here, far less than the images the site needed, and the evict-and-rebuild loop that followed was the first thing I found.
Frequently asked questions
Previous Article